
July - The last month to attempt meaningful legislation before the political season takes over
July - The last month to attempt meaningful legislation before the political season takes over
Since the Coronavirus hit, Congress has passed and President Trump has signed four pieces of economic stimulus legislation designed to help deal with the unprecedented economic turmoil. The total of the pieces combined will cost an estimate of $2.4 Trillion over the next ten years. Now, what are the chances that Congress will pass one last stimulus package that lawmakers are working on before the end of this month?
In this pandemic, the bipartisan has come together unhesitant for the sake of saving their economy and its people putting aside their differences. Will the same spirit follow through on this last legislation?
The main bipartisan issues are:
To make things worse, the Republicans are divided within their own.
How does all of this translate for the US SP&500 Index?
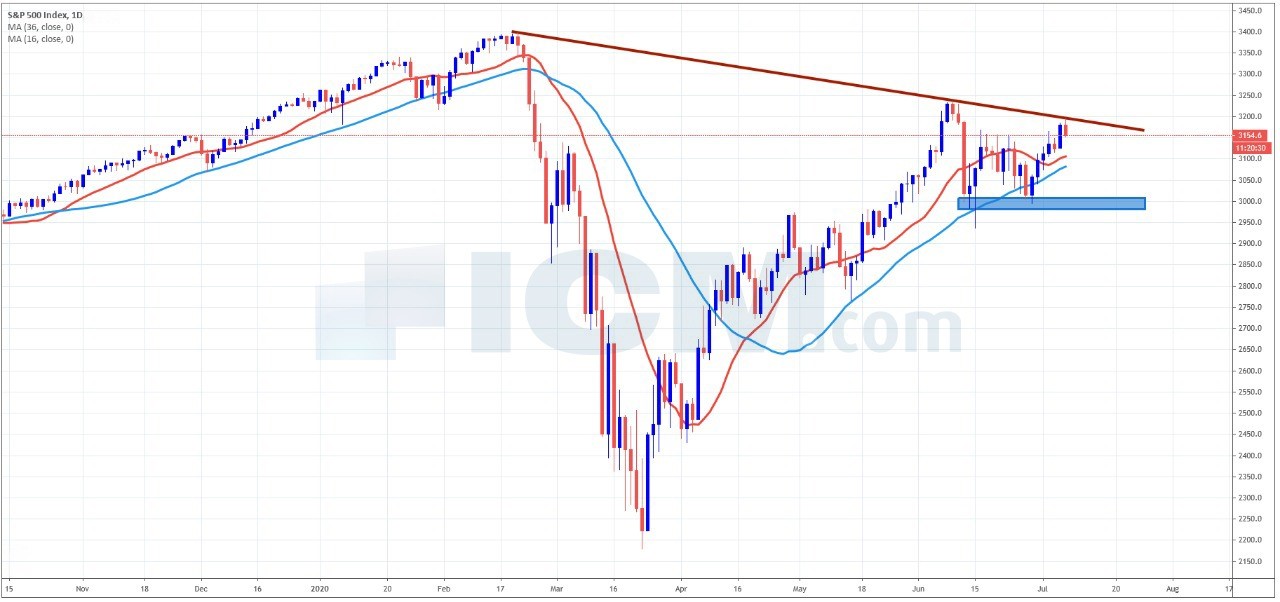
A 4 months old trend line has proved to be a solid resistance for the Index. (Daily chart below).
Looking at the nitty-gritty details (4hr chart below), we might find that history could be repeating itself. In early June, the S&P trended upward in a channel from the 3,000 level towards a three-month high of 3,230. In the first week of July, an uptrend channel has formed at the 3,000 level only to make a lower high of 3,195, testing the resistance line.
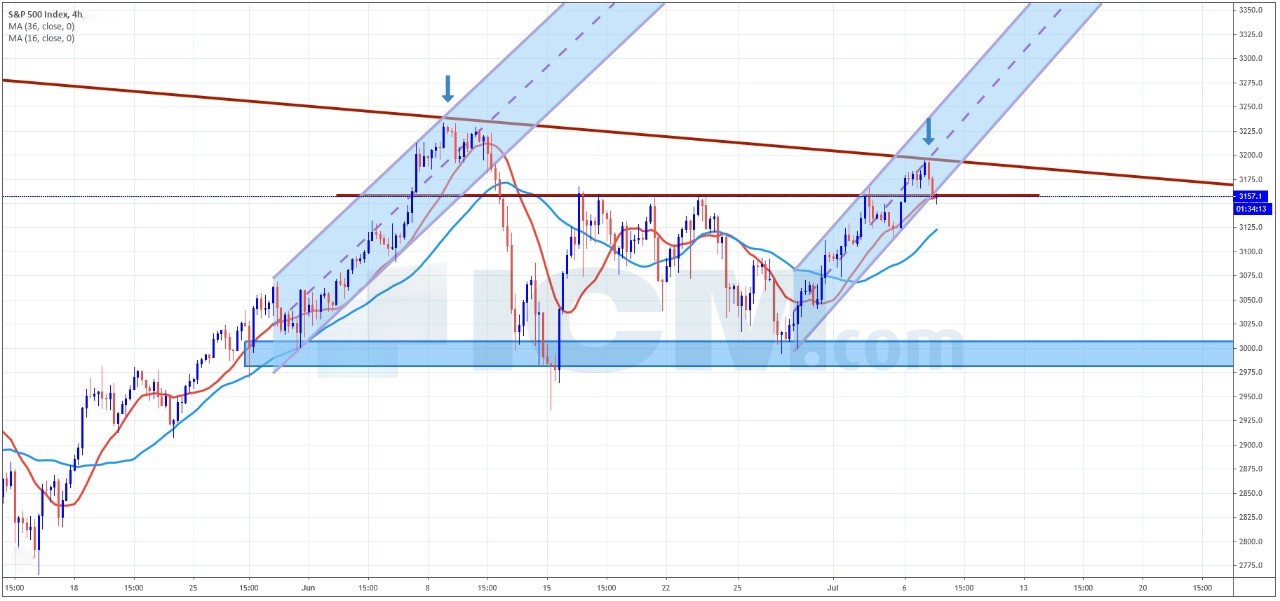
A combination of no new stimulus package and a daily close below the 3,150 level, could signify that the S&P500 could retest the support again at 3,000-2,985 area.
Disclaimer
The prices and news mentioned in this outlook are absolutely no guarantee of future market performance and do not represent the view of ICM.COM. Financial markets can move in either direction causing profits to be made or complete losses to be incurred by the trader. Each trader must decide for themselves what their risk appetite is and ensure that correct risk management procedures are in place before placing any trades.
 Mail
Mail
 Call
Call
 Chat
Chat
 Chat
Chat